Edit chart
Loading graph
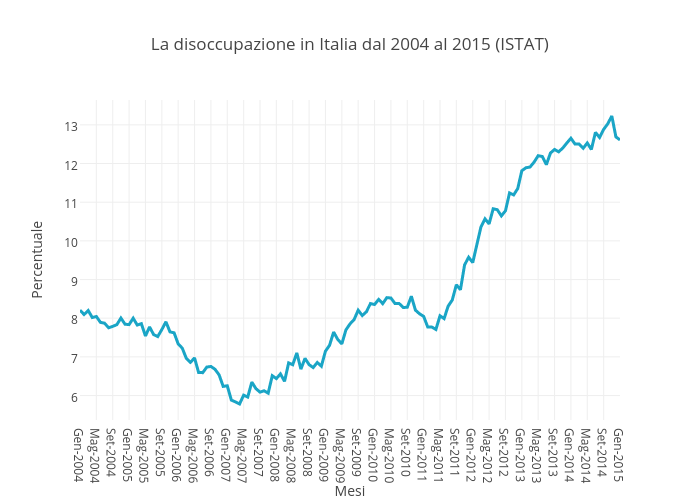
Ilpost's interactive graph and data of "La disoccupazione in Italia dal 2004 al 2015 (ISTAT)" is a scatter chart, showing Col3; with Mesi in the x-axis and Percentuale in the y-axis.. The x-axis shows values from 0 to 132. The y-axis shows values from 5.366514166666667 to 13.642890833333334.